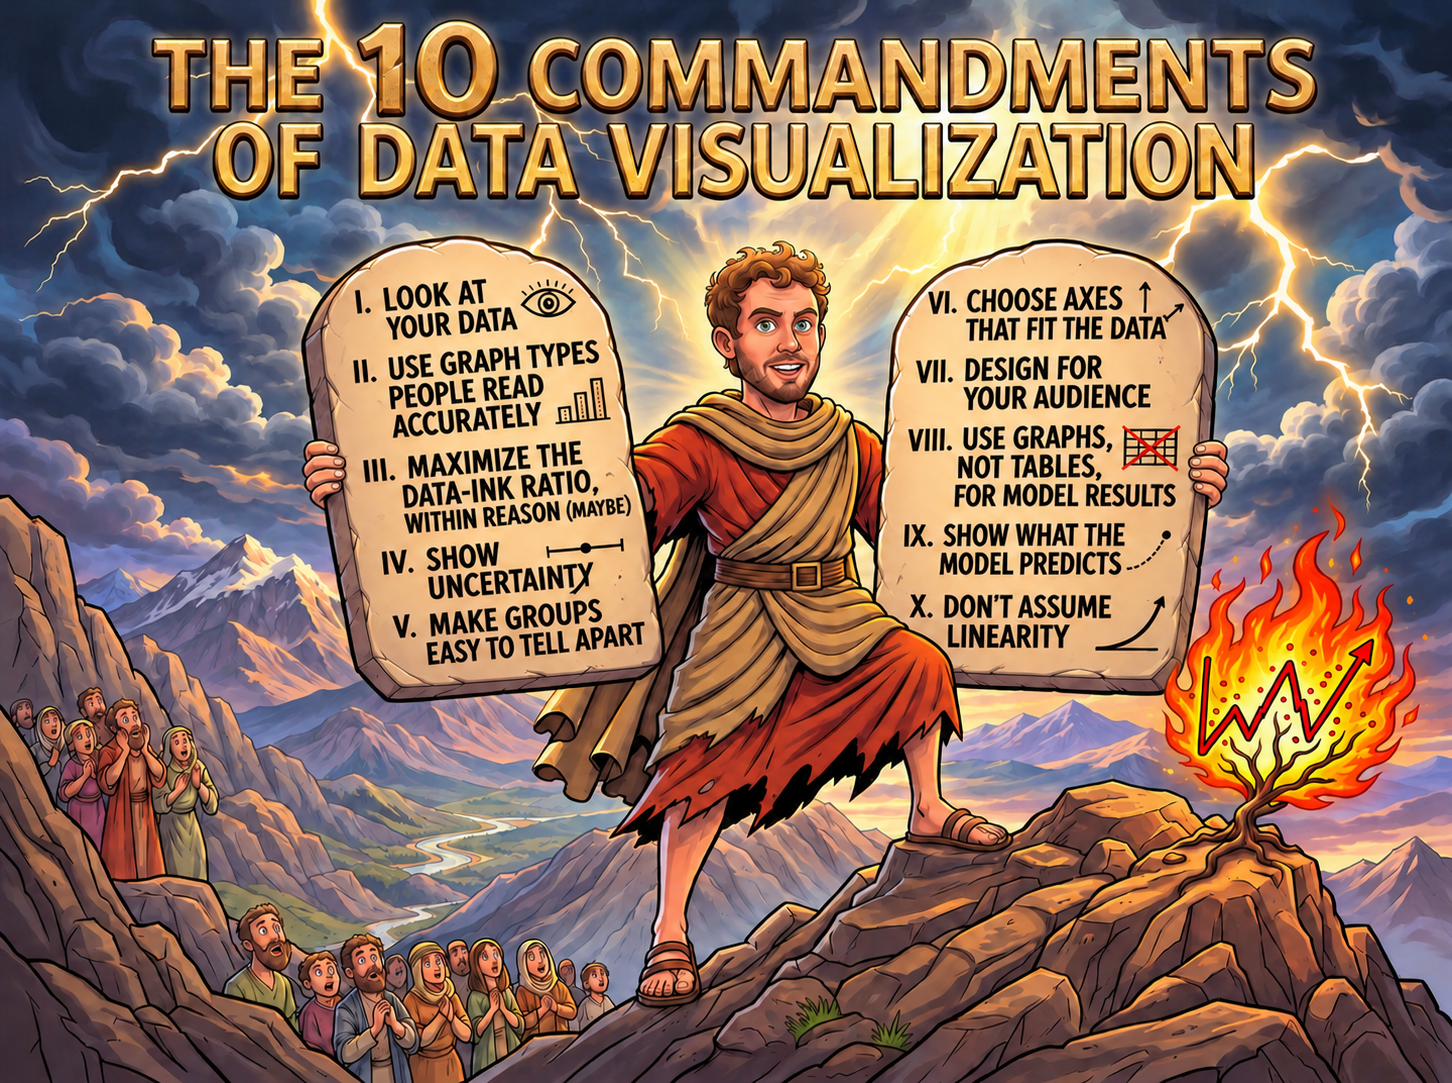
- Look at your data
- Problems and/or quirks with the data are easily ascertained
- Modeling strategies often become clear only after examining the data
- Use graph types people read accurately
- Angles and areas are difficult to judge accurately; a common scale is necessary to compare across groups
- Bar charts and dot plots are among the most effective tools for comparing amounts across groups
- Maximize the data-ink ratio, within reason (maybe)
- All aspects of the graph should aid in presenting the data
- My less strict rule: all color should convey some information
- Show uncertainty
- Confidence intervals and standard errors should be included for model estimates / predictions
- Be clear in your graph and/or text whether CIs or SEs are being plotted
- Make groups easy to tell apart
- A legend should clearly delineate between the groups or data should be labeled directly
- The colors and/or symbols on the graph should clearly delineate between different lines/groups
- Choose axes that fit the data
- The “ticks” and gaps on the axes should be clear and logical
- The y-axis (and usually the x-axis as well) should cover at least the 10th to the 90th percentile of observed values
- Design for your audience
- All graphs should have a descriptive, informative title and substantive axis labels
- Talks: the font in the graph should be large enough to be easily read from afar
- Use graphs, not tables, for model results
- Talks: keep your audience awake (and aid more rapid interpretation): use graphics whenever possible
- Coefficient plots are very effective for replacing regression tables
- Show what the model predicts
- The most effective way to understand a model is almost always to examine what the model predicts
- Do not connect predictions for nominal IVs with lines
- Don’t assume linearity
- Examine the functional form of the relationship between your predictor and your outcome before you fit a model
Back to top