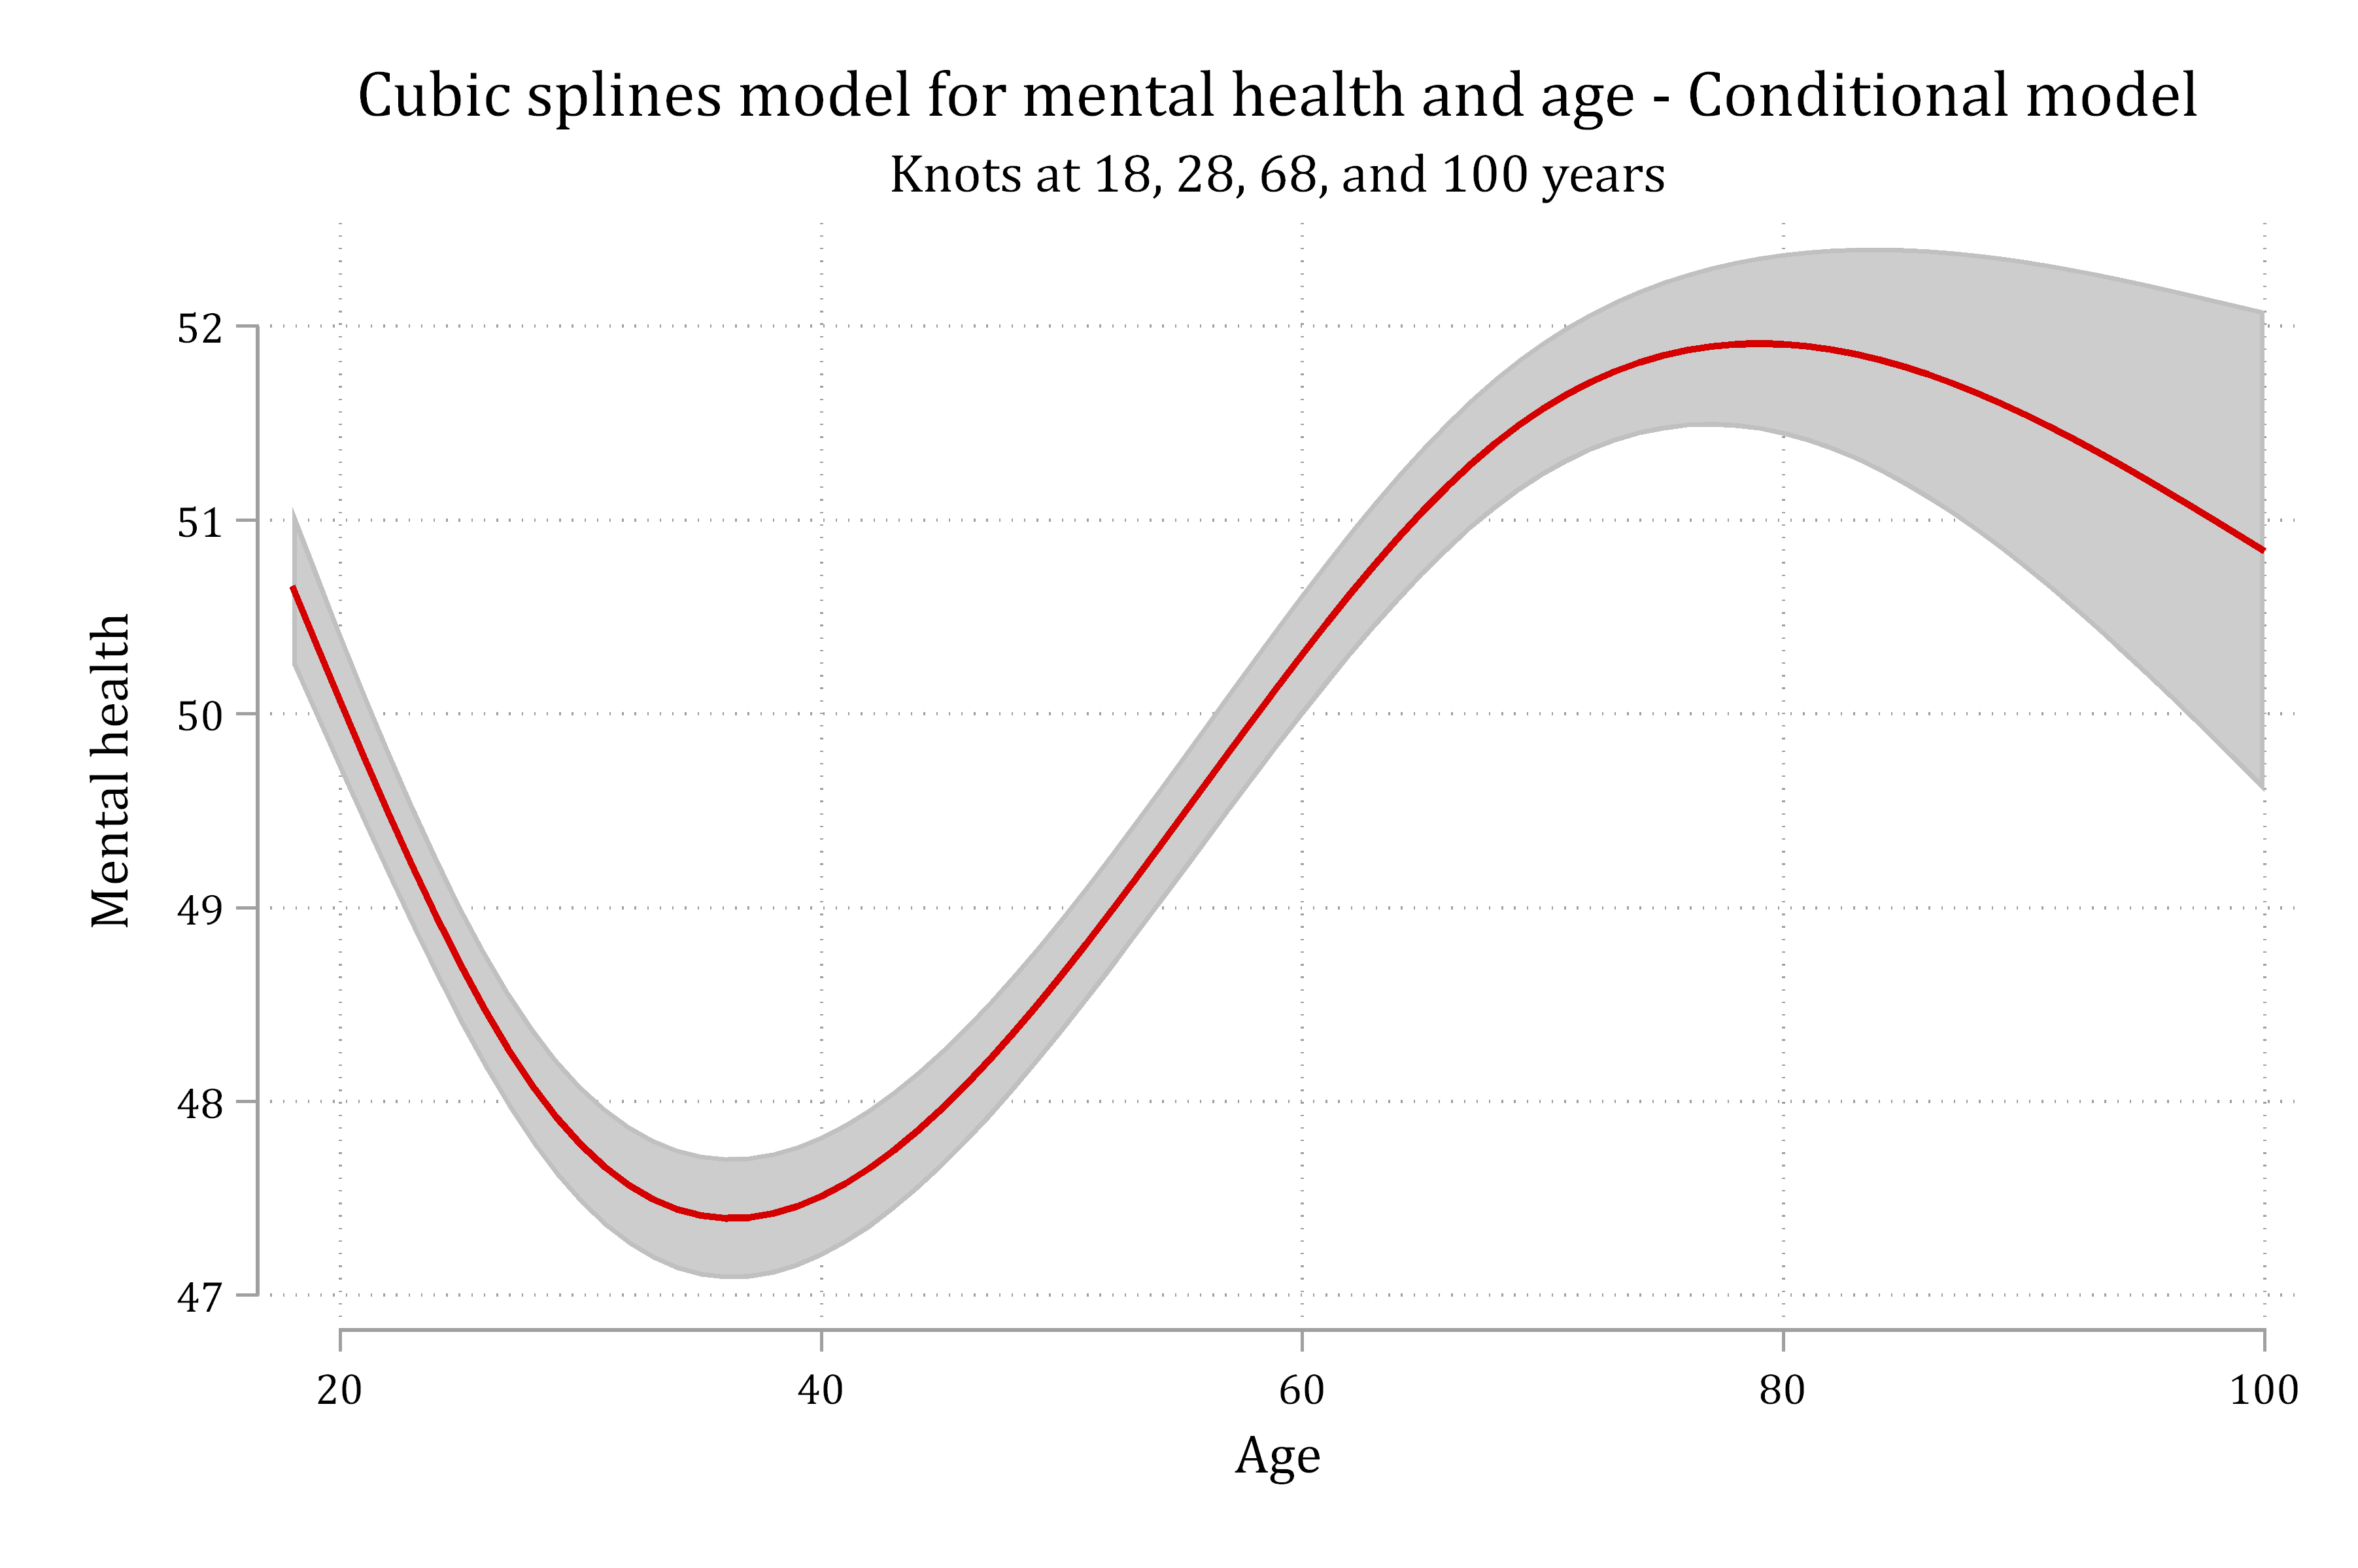
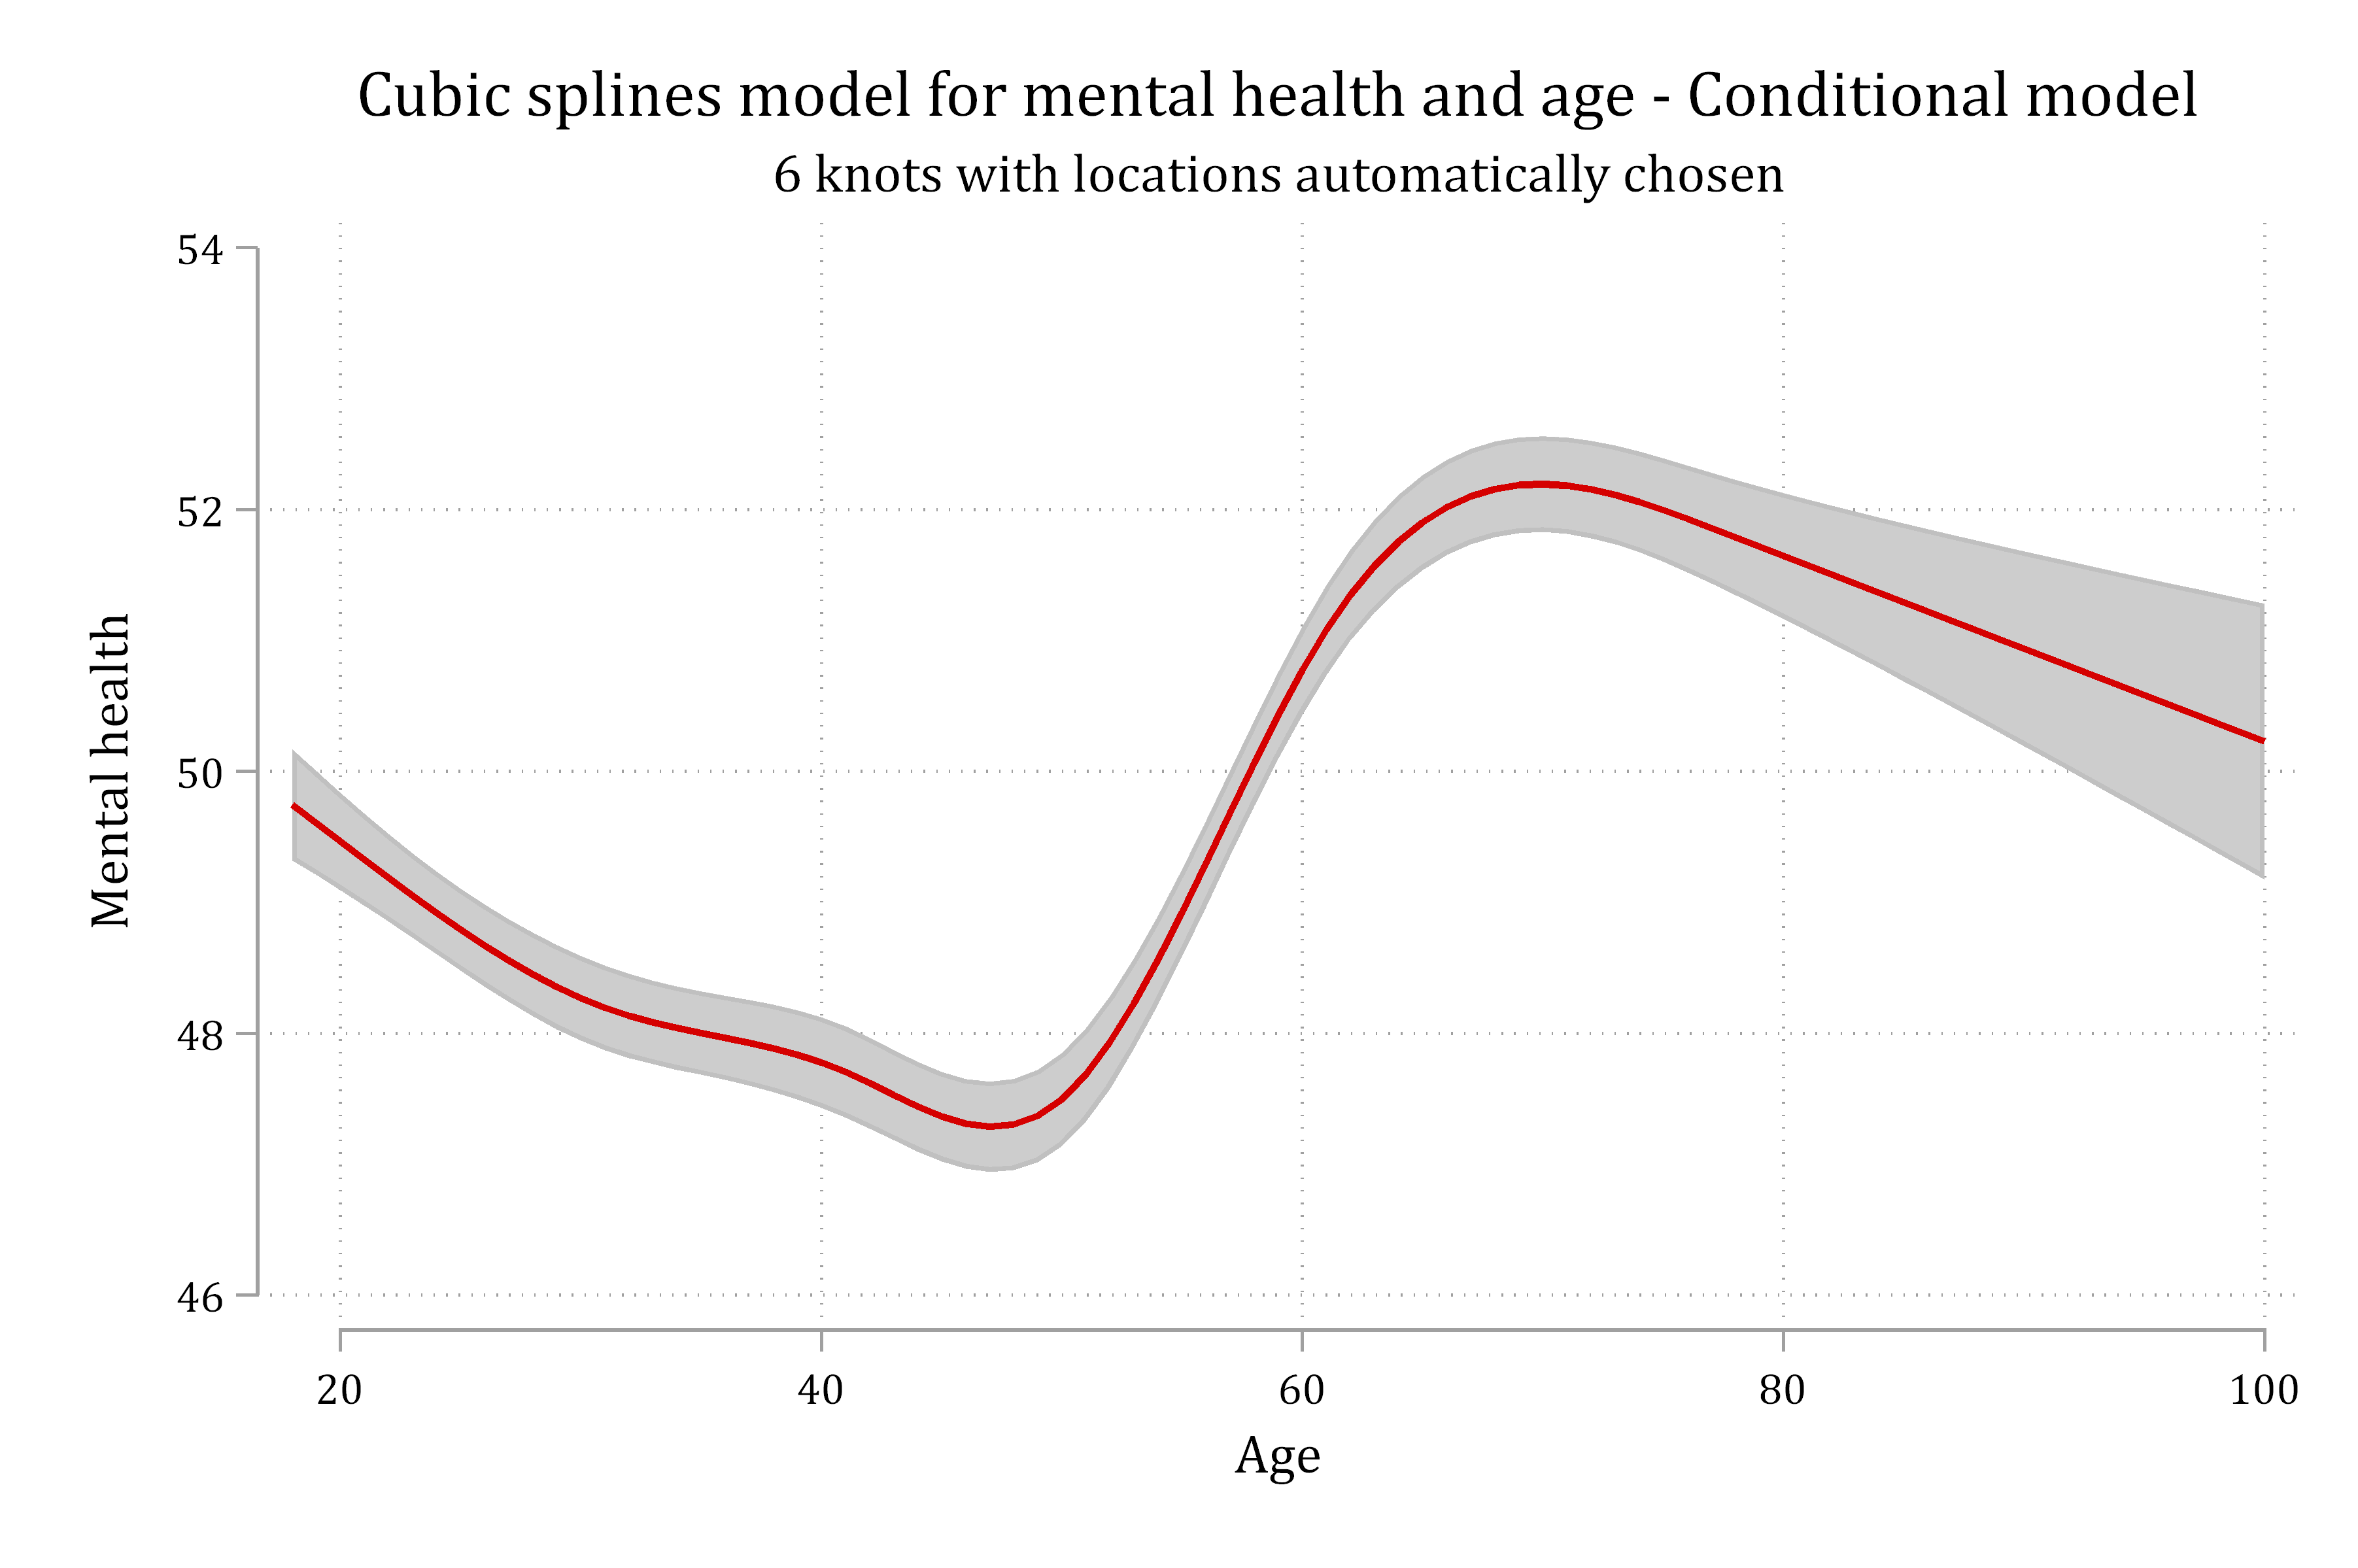
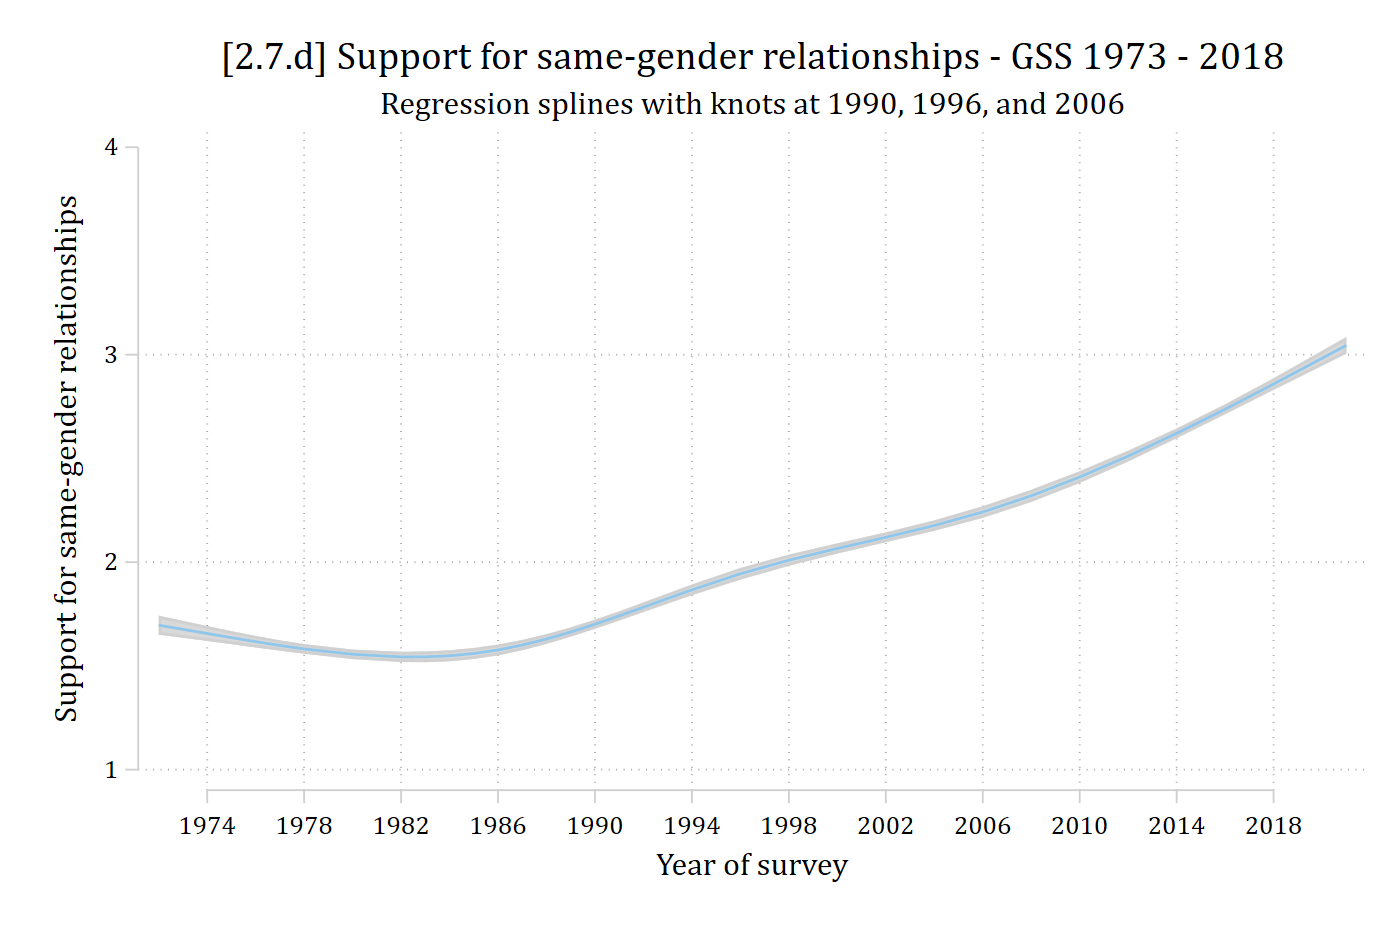
To plot predictions from the spline regression model, use the original year variable and over( ) with margins. Then plot as normal with marginsplot
margins, over(year)marginsplot, recastci(rarea) ciopts(col(gs13)) plotopts(msymbol(none)) /// xlab(1974(4)2018) ylab(1(1)4) ///ytitle("Support for same-gender relationships") xtitle("Year of survey") ///title("Support for same-gender relationships - GSS 1973 - 2018", size(medlarge)) ///subtitle("Regression splines with knots at 1990, 1996, and 2006")
Cubic splines
Cubic splines are especially helpful for modeling complex nonlinearities
Allows for both changes of directions at “knots” and for nonlinearities between the knots
Can specify where knots are yourself (e.g. after examining the nominal specification)
Or, can specify # of knots and let software find best places
Note this introduces complications in estimation, plotting, and testing effects
I mostly use cubic splines only as exploratory. I would worry about “overfitting” your data if you tried to use them in a confirmatory regression model
Estimating and plotting cubic spline models
For cubic splines, use cubic option on mkspline (see help file for options. By default, it will choose the # of knots (5) and the locations)
Note I recommend using mkspline2 so you can use adjustrcspline to plot the predictions
Both are part of Buis’s package postrcspline which is very useful for plotting cubic spline model predictions
adjustrcspline, ciopts(col(gs13)) /// xlab(1974(4)2018) ylab(1(1)4) ///ytitle("Support for same-gender relationships") xtitle("Year of survey") ///title("[2.7.d] Support for same-gender relationships - GSS 1973 - 2018", size(medlarge)) ///subtitle("Regression splines with knots at 1990, 1996, and 2006")