desctable
Stata command for descriptive statistics tables
desctable creates formatted descriptive statistics tables using Stata. The table is automatically exported to Excel, where it can be easily copied and pasted to Word without losing the formatting. desctable treats continuous, binary, and nominal variables differently – providing formatting, labeling, and statistics that are most appropriate for the measurement level of each variable. Binary and nominal variables are entered with the i. prefix; variables without a prefix are treated as continuous. Rows are labeled with the variable labels, and the categories of nominal variables with their value labels, so a well-labeled dataset produces a table that needs no further editing.
Installation
net install desctable, from("https://tdmize.github.io/data") replaceTo read the help file in Stata, type help desctable; it is also on this site. desctable uses putexcel, so Stata 14.1 or newer is required.
Citation
In general, I do not think the use of desctable requires citation. So for most cases, feel free to use desctable without citation. But, if you need or want a citation you can cite desctable as:
Mize, Trenton D. and Bianca Manago. 2018. “desctable: Stata command for descriptive statistics tables.” https://www.trentonmize.com/software/desctable
Examples
The examples use Stata’s nlsw88 data. filename() is the only required option: it names the Excel file that the table is written to. The default table reports the mean (the proportion for binary and nominal variables) and the standard deviation of the continuous variables.
sysuse nlsw88, clear(NLSW, 1988 extract)desctable wage age i.race i.union i.collgrad tenure i.occupation hours, ///
filename("descriptivesEX1")Sample size reported at the top of the table is # of total observations in the data.
The sample size varies across variables in the table due to missing data.
388 observations have some missing data on variables in the table.
- Variables with missing data are:
union tenure occupation hours
Use the stat(n) option to show the # of non-missing obs for each variable.
Use the listwise option to exclude observations with any missing data.
..
Descriptive statistics table has been saved in the folder:
C:\Users\trent\stata\desctable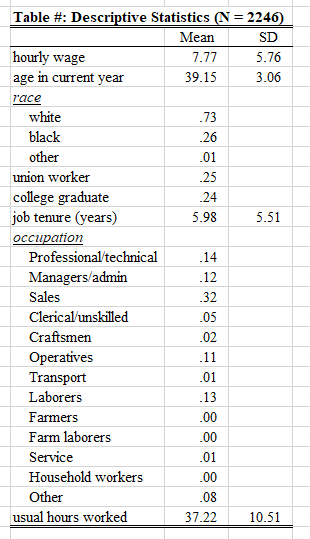
stats() chooses the statistics and their order. Frequencies are reported for the categories of nominal variables, and the minimum, maximum, interquartile range, and median for continuous variables:
desctable wage age i.race i.union i.collgrad tenure i.occupation hours, ///
    filename("descriptivesEX2") stats(mean freq sd min max iqr median)
Sample size reported at the top of the table is # of total observations in the data.
The sample size varies across variables in the table due to missing data.
388 observations have some missing data on variables in the table.
- Variables with missing data are:
union tenure occupation hours
Use the stat(n) option to show the # of non-missing obs for each variable.
Use the listwise option to exclude observations with any missing data.
.......
Descriptive statistics table has been saved in the folder:
C:\Users\trent\stata\desctable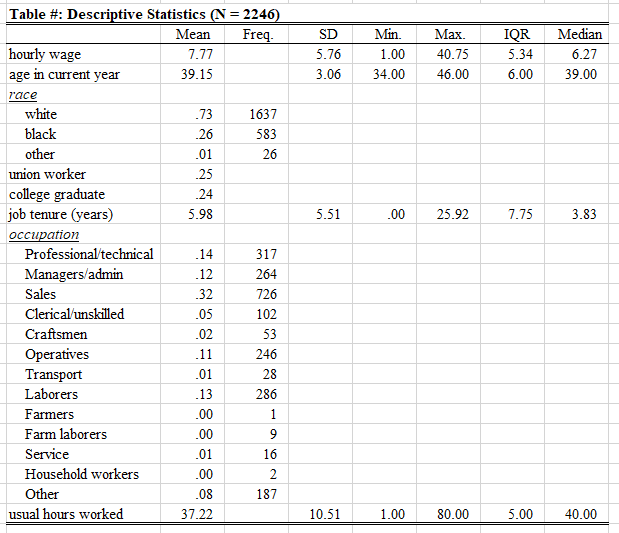
group() reports the statistics separately for each category of a nominal grouping variable, side by side:
desctable wage age i.union i.collgrad tenure i.occupation hours, ///
    filename("descriptivesEX5") group(race)
Sample size reported at the top of the table is # of total observations in the data.
The sample size varies across variables in the table due to missing data.
388 observations have some missing data on variables in the table.
- Variables with missing data are:
union tenure occupation hours
Use the stat(n) option to show the # of non-missing obs for each variable.
Use the listwise option to exclude observations with any missing data.
......
Descriptive statistics table has been saved in the folder:
C:\Users\trent\stata\desctable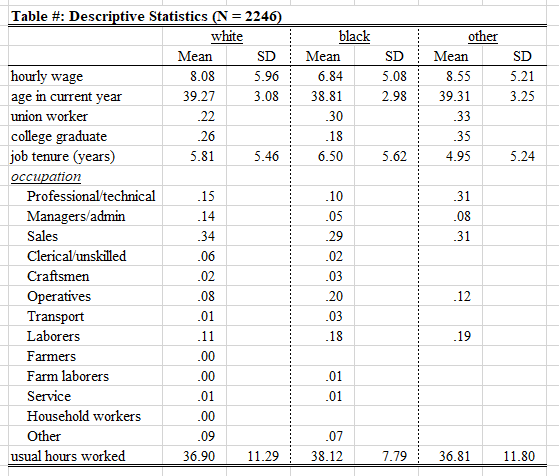
The help file lists the other options: the full set of available statistics (including survey-weighted and multiple-imputation means), decimals(), listwise, notes(), title(), and the font and layout settings. The help-file examples run several of them.