cleanplots color scales for ggplot2
Color and fill scales for groups that use the cleanplots colors, the same colors as my cleanplots scheme for Stata. They are designed for clean, publication-ready plots, including plots of predictions and marginal effects.
Usage
scale_color_cleanplots(
  palette = "default",
  reverse = FALSE,
  order = 1:10,
  aesthetics = "color",
  ...
)

scale_colour_cleanplots(
  palette = "default",
  reverse = FALSE,
  order = 1:10,
  aesthetics = "color",
  ...
)

scale_fill_cleanplots(
  palette = "default",
  reverse = FALSE,
  order = 1:10,
  aesthetics = "fill",
  ...
)
Arguments
- palette
-
Character name of palette:
"default"or"bars". - reverse
-
Logical. Should the palette be reversed?
- order
-
A vector of numbers from 1 to 10 indicating the order of colors to use (default:
1:10). - aesthetics
-
A vector of aesthetic names this scale should apply to (e.g.,
"color"or"fill"). - …
-
Additional arguments passed to
ggplot2::discrete_scale().
Details
The "default" palette contains the 10 colors used for markers, lines, and confidence intervals. The "bars" palette contains the softer, lighter versions of the same colors that the Stata scheme uses for bar charts, area plots, and pie charts (because those elements use much more ink); it is typically paired with scale_fill_cleanplots().
The cleanplots palette is only available as a discrete palette.
References
Mize, T. D. cleanplots: Stata graphing scheme. https://www.trentonmize.com/software/cleanplots
Examples
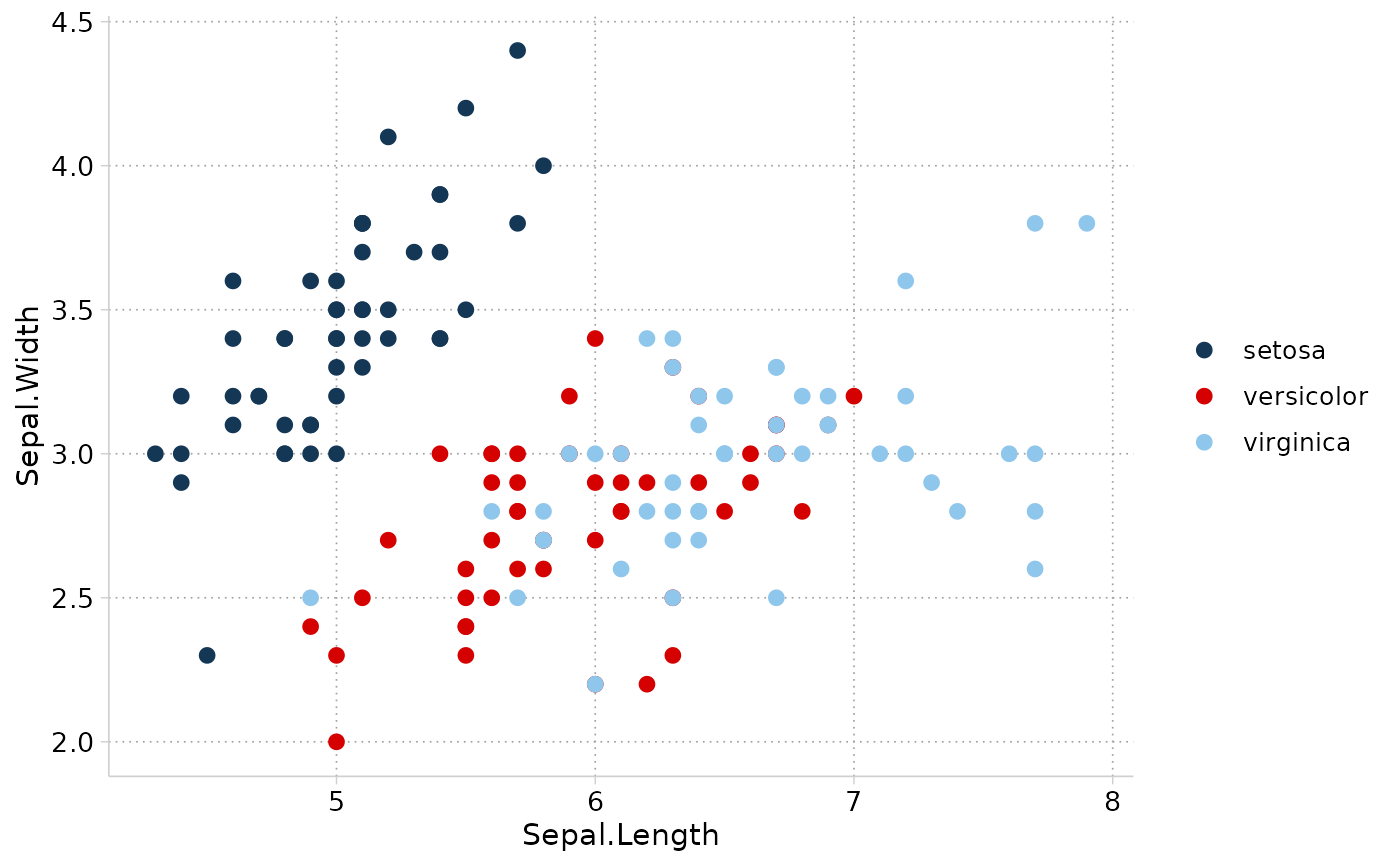
library(ggplot2)

ggplot(iris, aes(x = Sepal.Length, y = Sepal.Width, color = Species)) +
  geom_point(size = 2) +
  theme_cleanplots() +
  scale_color_cleanplots()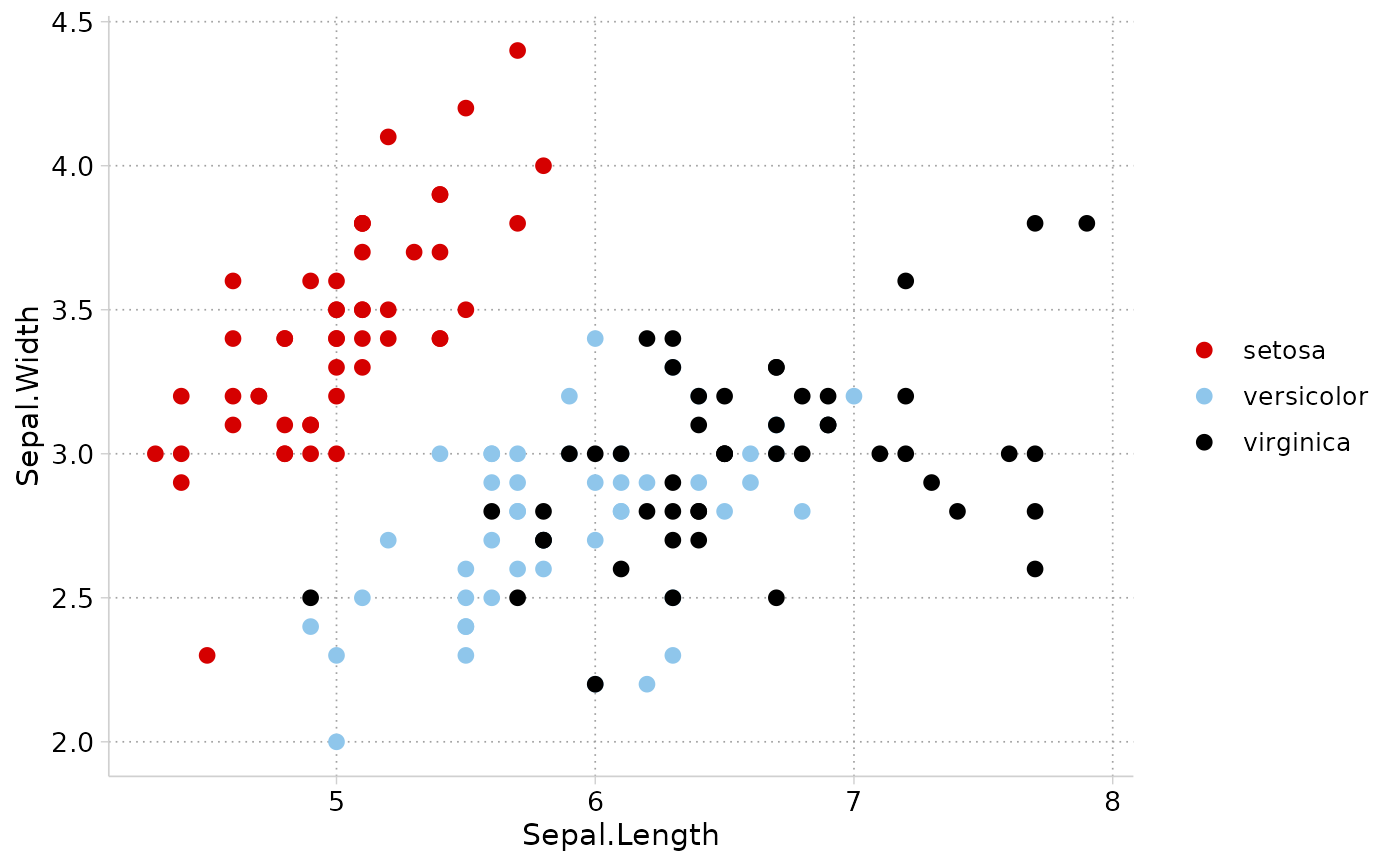
ggplot(iris, aes(x = Species, y = Sepal.Length, fill = Species)) +
  geom_boxplot() +
  theme_cleanplots() +
  scale_fill_cleanplots(palette = "bars")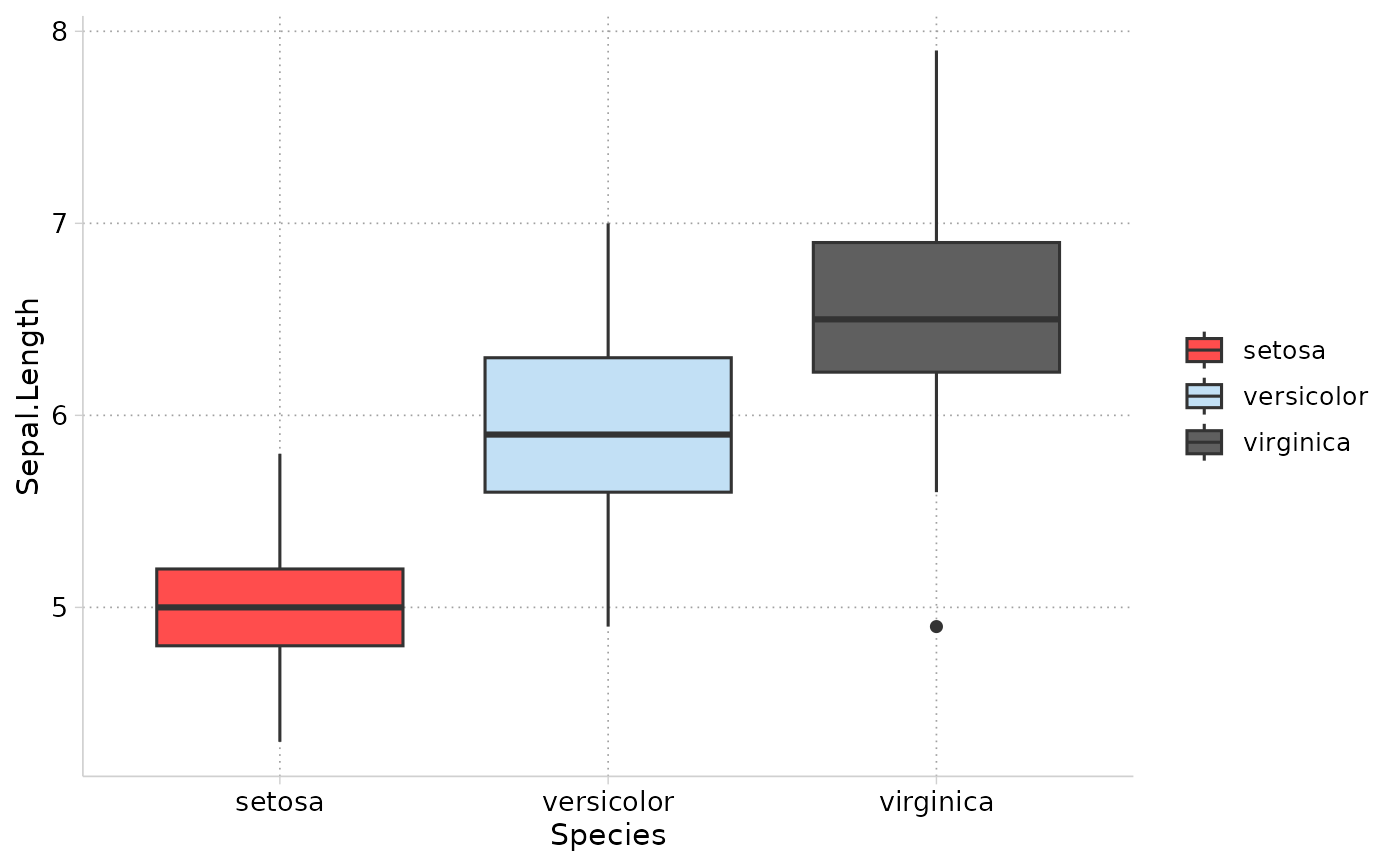
# Use colors in a different order
ggplot(iris, aes(x = Sepal.Length, y = Sepal.Width, color = Species)) +
  geom_point(size = 2) +
  theme_cleanplots() +
  scale_color_cleanplots(order = c(7, 1, 2))