cleanplots shape and linetype scales for ggplot2
Shape and line pattern scales that match the cleanplots markers and line patterns. Together with scale_color_cleanplots(), they keep groups distinguishable in black and white and for colorblind readers: markers are hollow for the dark colors and solid for the light colors, and groups that share a line pattern always differ a lot in lightness.
Usage
scale_shape_cleanplots(...)

scale_linetype_cleanplots(...)
Arguments
- …
-
Additional arguments passed to
ggplot2::scale_shape_manual()orggplot2::scale_linetype_manual().
Examples
library(ggplot2)

ggplot(iris, aes(Sepal.Length, Sepal.Width,
                 color = Species, shape = Species)) +
  geom_point(size = 2) +
  theme_cleanplots() +
  scale_color_cleanplots() +
  scale_shape_cleanplots()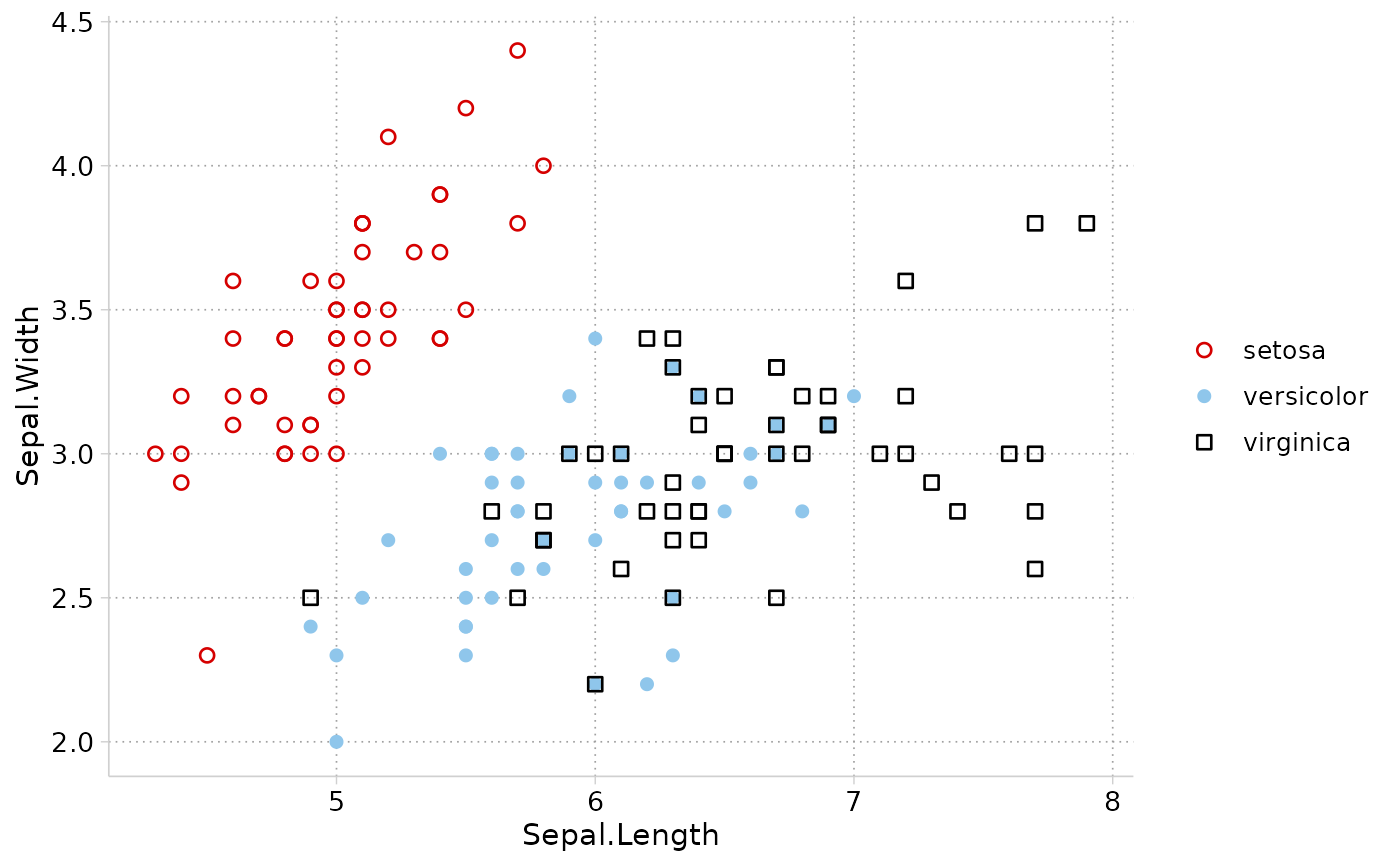
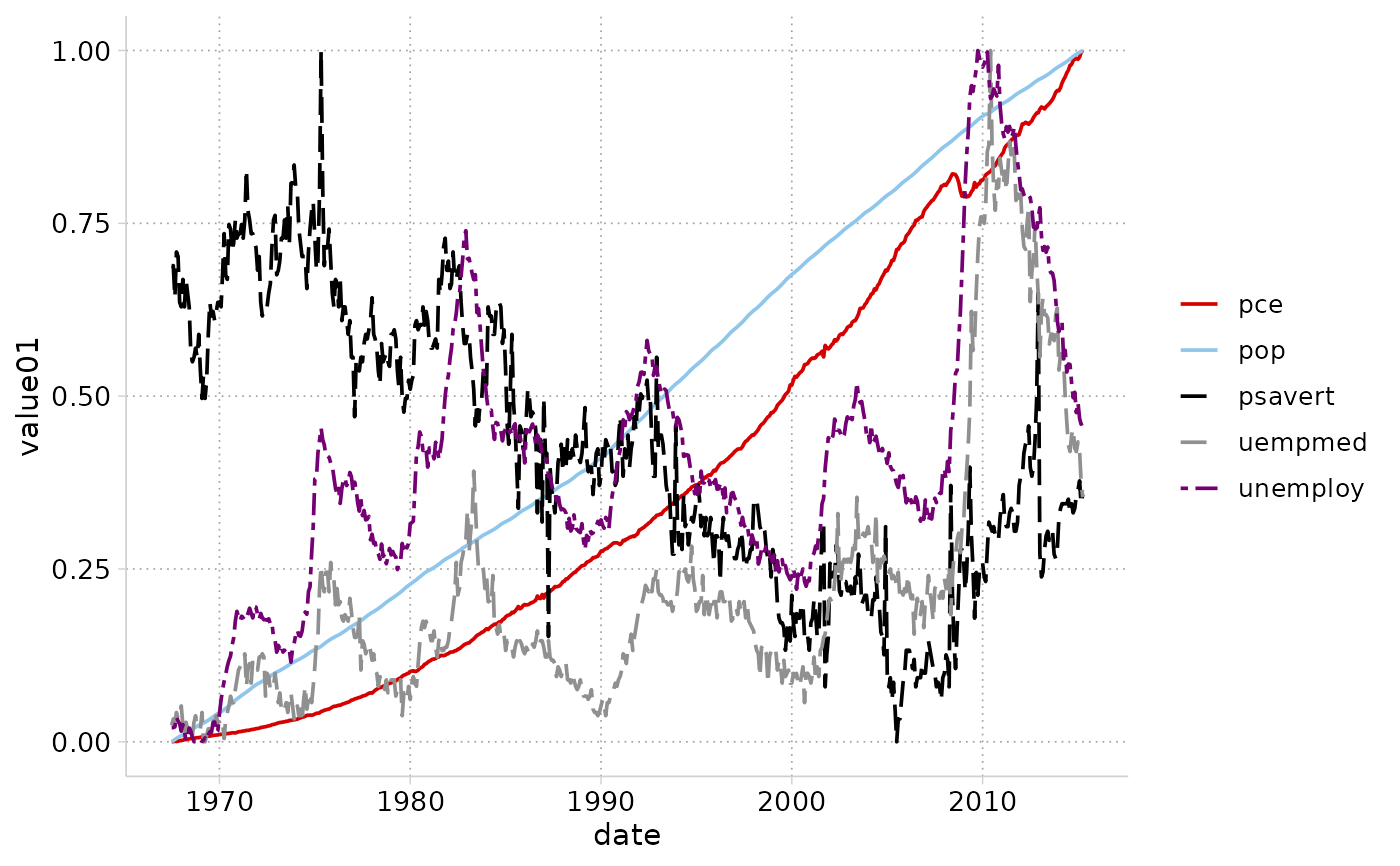
ggplot(economics_long, aes(date, value01,
                           color = variable, linetype = variable)) +
  geom_line() +
  theme_cleanplots() +
  scale_color_cleanplots() +
  scale_linetype_cleanplots()