Matching and teffects
Balance before and after matching: matchweight() after psmatch2, and tebalance after teffects
The original use of a balance plot is to show that matching or weighting has done its job: the covariates that were imbalanced before matching are balanced after it. balanceplot supports this two ways. matchweight() takes the matching weights produced by a command such as psmatch2 and plots the unweighted and weighted balance together. tebalance works after Stata’s own teffects and stteffects estimators, plotting the standardized differences that tebalance summarize returns.
matchweight() after psmatch2
After ATT matching with psmatch2, _weight is 1 for treated observations and records how often each matched control was used; unmatched controls have a missing weight. matchweight(_weight) applies those weights to the base group (the controls) and shows the original complete-case balance and the weighted matched balance in one graph, one color per comparison and a different marker for the unweighted and weighted estimates.
sysuse nlsw88, clear(NLSW, 1988 extract)psmatch2 union age tenure grade, neighbor(1) logitLogistic regression Number of obs = 1,866
LR chi2(3) = 42.83
Prob > chi2 = 0.0000
Log likelihood = -1019.5818 Pseudo R2 = 0.0206
------------------------------------------------------------------------------
union | Coefficient Std. err. z P>|z| [95% conf. interval]
-------------+----------------------------------------------------------------
age | 0.003 0.018 0.164 0.870 -0.032 0.038
tenure | 0.048 0.009 5.208 0.000 0.030 0.067
grade | 0.072 0.022 3.338 0.001 0.030 0.115
_cons | -2.534 0.771 -3.289 0.001 -4.045 -1.024
------------------------------------------------------------------------------balanceplot age tenure grade, group(union) matchweight(_weight)NOTE: 12 observations were excluded due to missing data on
at least one covariate, group(), or outcome() variable.
NOTE: 1060 additional base-group observations were excluded from
weighted calculations due to a zero or missing matchweight().
Base category = 0_Nonunion
Base selected by the 0/1 two-group default.
N used in unweighted balance calculations
- N for union = 0_Nonunion: 1407
- N for union = 1_Union: 459
N used in weighted balance calculations
matchweight(_weight) applies to the base group only; all nonbase groups have weight 1.
- N for union = 0_Nonunion: 347; sum of matching weights = 459
- N for union = 1_Union: 459graph export "fig/matching-matchweight.png", replace width(1400)file fig/matching-matchweight.png saved as PNG format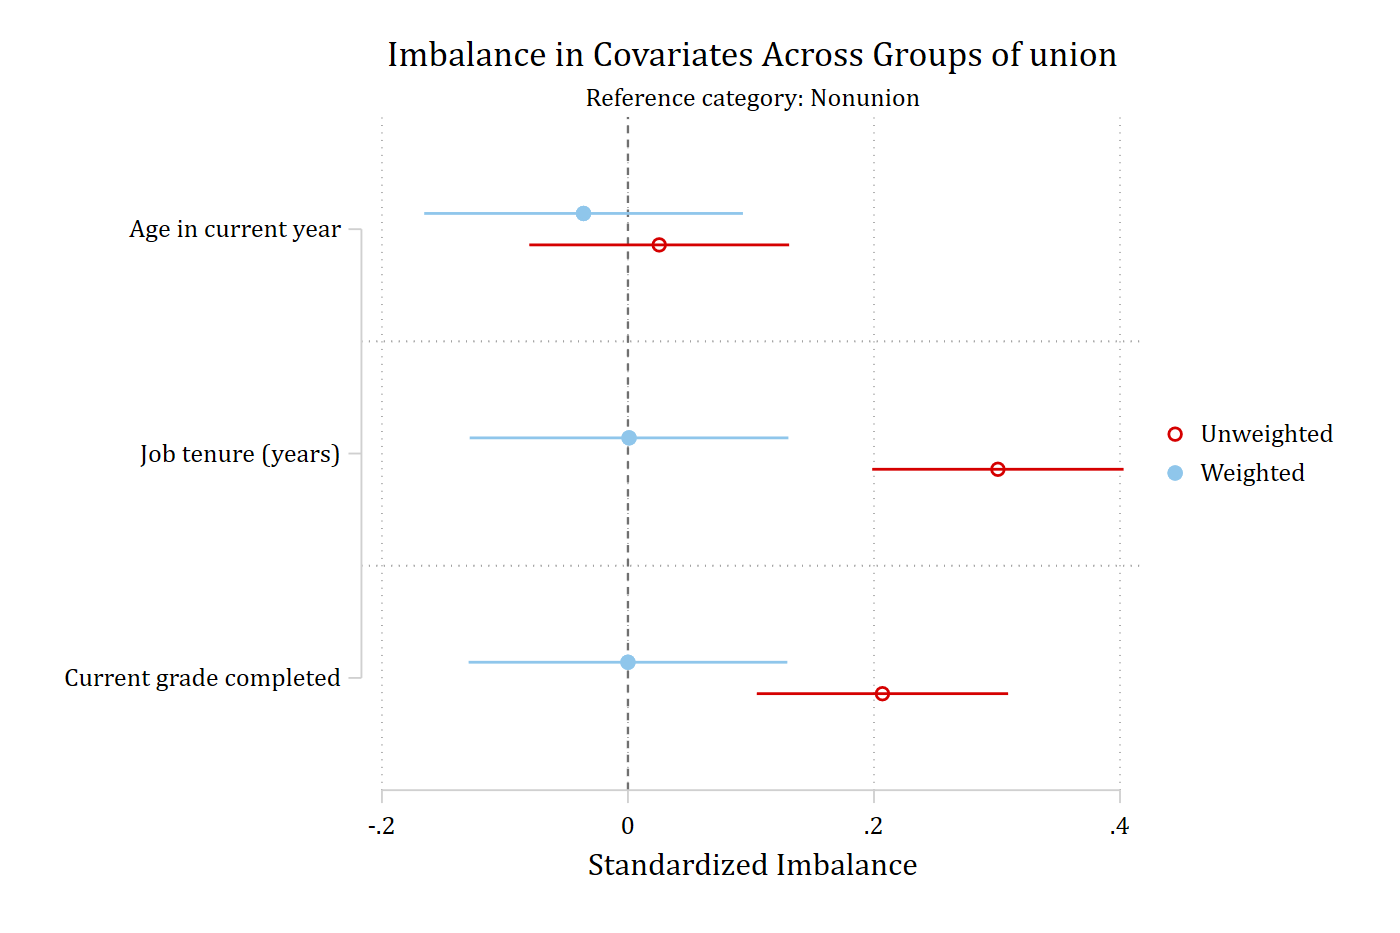
This matches psmatch2’s convention of controls coded 0 and treated coded 1. If the control category is not the default base, name it with base(). fadens fades each estimate according to its own p-value, and sort orders the covariates by the weighted estimates.
With table, an unweighted table is followed by a weighted one:
balanceplot age tenure grade, group(union) matchweight(_weight) tableNOTE: 12 observations were excluded due to missing data on
at least one covariate, group(), or outcome() variable.
NOTE: 1060 additional base-group observations were excluded from
weighted calculations due to a zero or missing matchweight().
Base category = 0_Nonunion
Base selected by the 0/1 two-group default.
N used in unweighted balance calculations
- N for union = 0_Nonunion: 1407
- N for union = 1_Union: 459
N used in weighted balance calculations
matchweight(_weight) applies to the base group only; all nonbase groups have weight 1.
- N for union = 0_Nonunion: 347; sum of matching weights = 459
- N for union = 1_Union: 459
Unweighted balance results: Nonunion (N=1,407) vs Union (N=459)
| union=0 | union=1 | Standard~d | _
Covariate | Mean | Mean | Imbalance | p-value
-------------------------+------------+------------+------------+-----------
Age in current year | 39.204 | 39.281 | 0.025 | 0.637
Job tenure (years) | 6.136 | 7.871 | 0.301 | 0.000
Current grade completed | 13.036 | 13.580 | 0.207 | 0.000
Weighted balance results: Nonunion (N=347; sum w=459) vs Union (N=459)
| union=0 | union=1 | Standard~d | _
Covariate | Mean | Mean | Imbalance | p-value
-------------------------+------------+------------+------------+-----------
Age in current year | 39.392 | 39.281 | -0.036 | 0.585
Job tenure (years) | 7.865 | 7.871 | 0.001 | 0.989
Current grade completed | 13.580 | 13.580 | 0.000 | 1.000 store() posts both sets, with the prefixes stub_unw_ and stub_w_:
balanceplot age tenure grade, group(union) matchweight(_weight) store(bm, replace)NOTE: 12 observations were excluded due to missing data on
at least one covariate, group(), or outcome() variable.
NOTE: 1060 additional base-group observations were excluded from
weighted calculations due to a zero or missing matchweight().
Base category = 0_Nonunion
Base selected by the 0/1 two-group default.
N used in unweighted balance calculations
- N for union = 0_Nonunion: 1407
- N for union = 1_Union: 459
N used in weighted balance calculations
matchweight(_weight) applies to the base group only; all nonbase groups have weight 1.
- N for union = 0_Nonunion: 347; sum of matching weights = 459
- N for union = 1_Union: 459esttab bm_unw_mean_g0 bm_unw_mean_g1 bm_unw_imbalance, se label mtitles--------------------------------------------------------------------
(1) (2) (3)
bm_unw_mea~0 bm_unw_mea~1 bm_unw_imb~e
--------------------------------------------------------------------
Age in current year 39.20 39.28 0.0254
(0.0539)
Job tenure (years) 6.136 7.871 0.301***
(0.0521)
Current grade comp~d 13.04 13.58 0.207***
(0.0521)
--------------------------------------------------------------------
Observations 1407 459 1866
--------------------------------------------------------------------
Standard errors in parentheses
* p<0.05, ** p<0.01, *** p<0.001esttab bm_w_mean_g0 bm_w_mean_g1 bm_w_imbalance, se label mtitles--------------------------------------------------------------------
(1) (2) (3)
bm_w_mean_g0 bm_w_mean_g1 bm_w_imbal~e
--------------------------------------------------------------------
Age in current year 39.39 39.28 -0.0361
(0.0660)
Job tenure (years) 7.865 7.871 0.000878
(0.0660)
Current grade comp~d 13.58 13.58 0
(0.0660)
--------------------------------------------------------------------
Observations 347 459 806
--------------------------------------------------------------------
Standard errors in parentheses
* p<0.05, ** p<0.01, *** p<0.001tebalance after teffects and stteffects
After a supported teffects estimator (aipw, ipw, ipwra, nnmatch, psmatch) or stteffects estimator (ipw, ipwra), balanceplot, tebalance calls tebalance summarize and plots its raw and matched or weighted standardized differences.
sysuse nlsw88, clear(NLSW, 1988 extract)teffects psmatch (wage) (union age tenure grade), atetTreatment-effects estimation Number of obs = 1,866
Estimator : propensity-score matching Matches: requested = 1
Outcome model : matching min = 1
Treatment model: logit max = 3
--------------------------------------------------------------------------------------
| AI robust
wage | Coefficient std. err. z P>|z| [95% conf. interval]
---------------------+----------------------------------------------------------------
ATET |
union |
(Union vs Nonunion) | 0.891 0.280 3.180 0.001 0.342 1.439
--------------------------------------------------------------------------------------balanceplot, tebalance
graph export "fig/matching-tebalance.png", replace width(1400)file fig/matching-tebalance.png saved as PNG format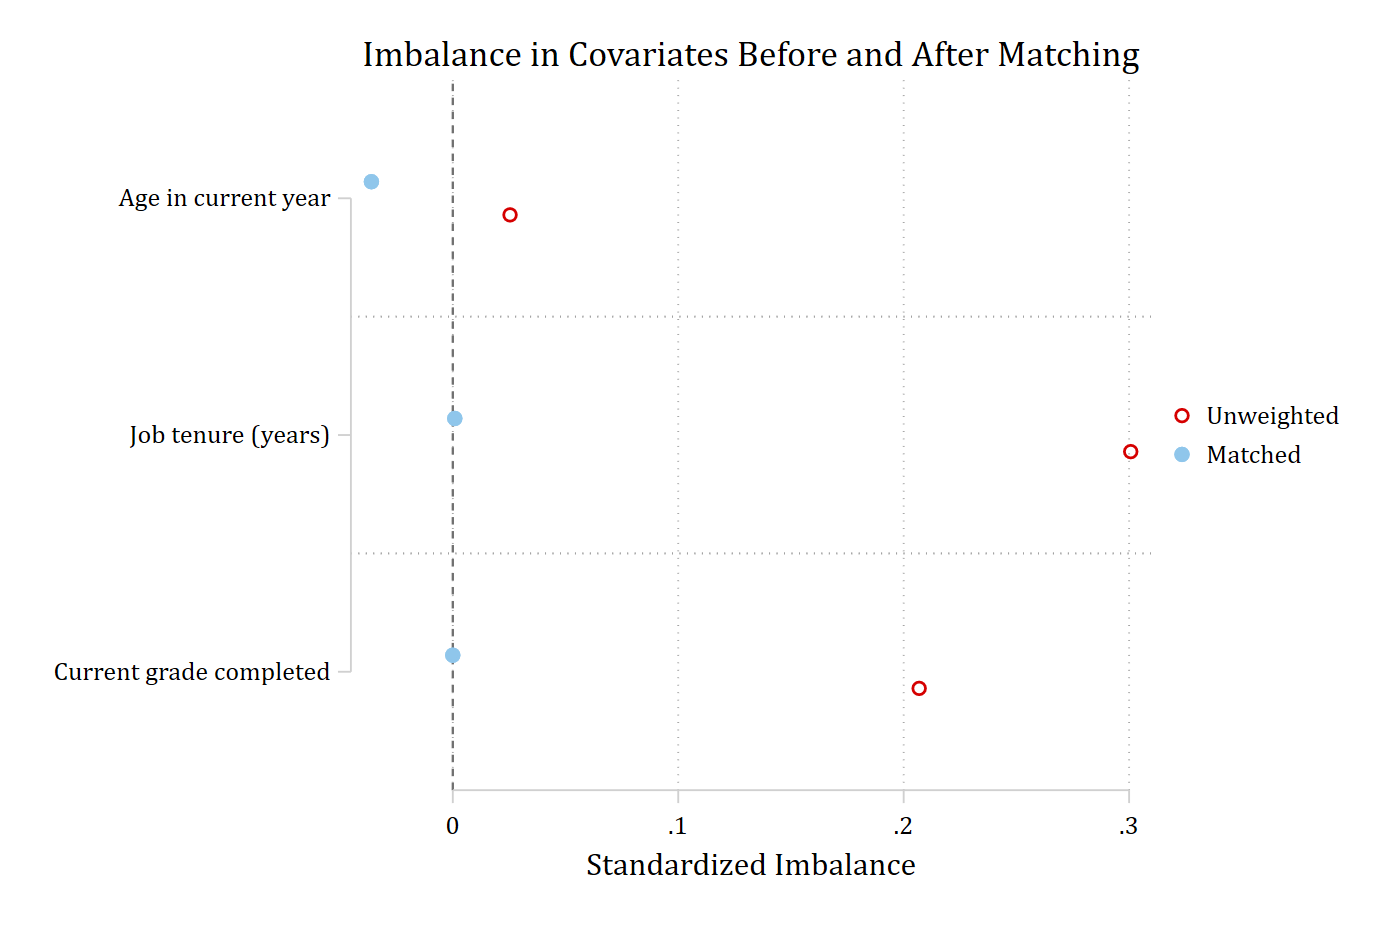
A varlist restricts the plot to some of the treatment-model covariates, and sort, absolute, threshold(), graphop(), and plotcommand are available:
balanceplot age tenure, tebalance absolute sort threshold(.1)
graph export "fig/matching-tebalance-sorted.png", replace width(1400)
file fig/matching-tebalance-sorted.png saved as PNG format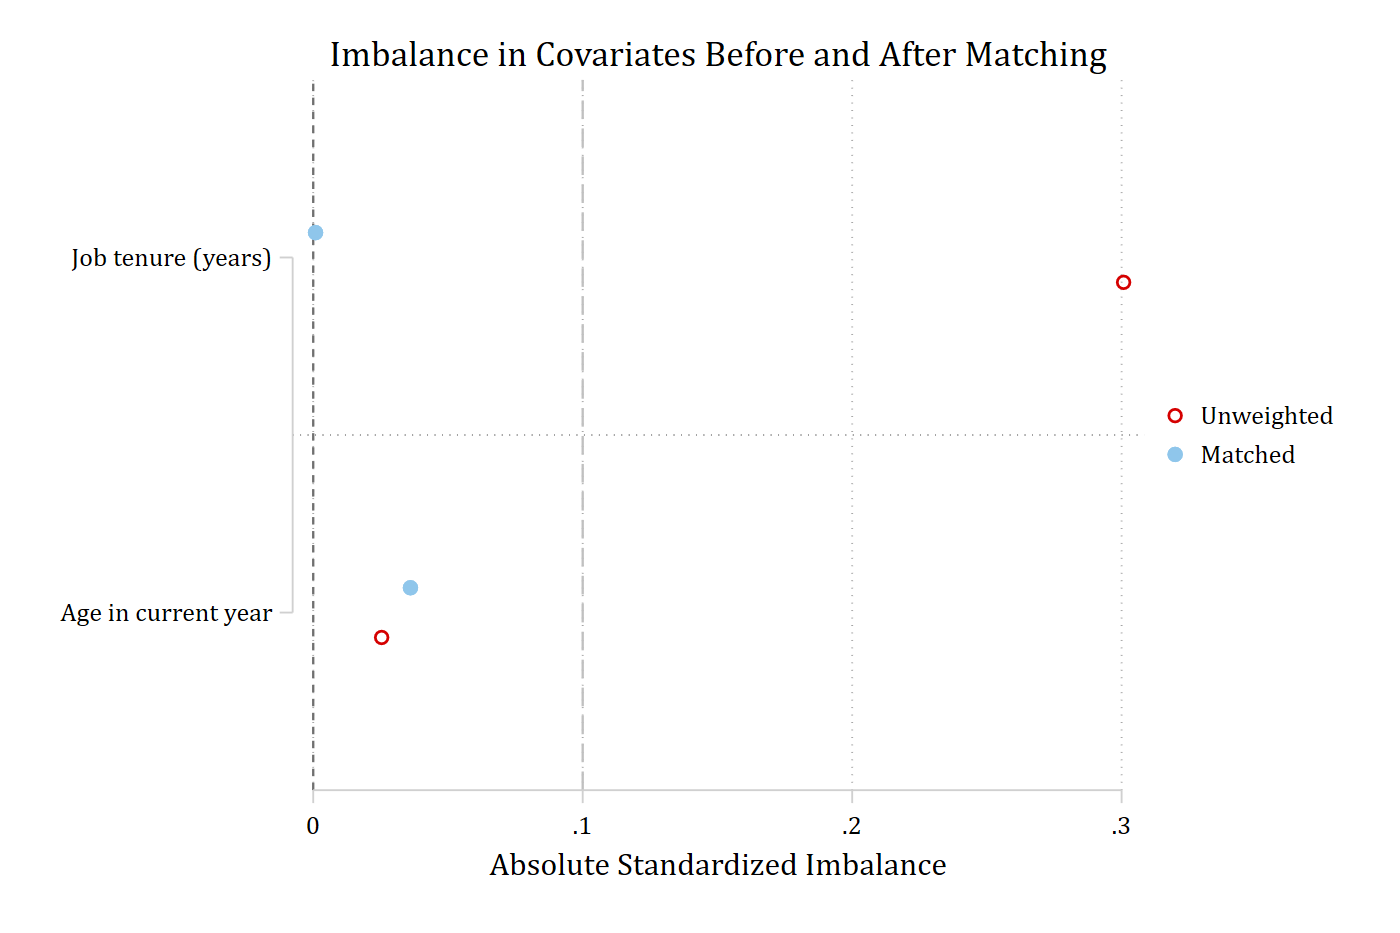
Because tebalance summarize does not return standard errors, confidence intervals and fadens are not available in this mode. With a multivalued treatment, each nonbase comparison is shown as its own block under the treatment category’s heading. The matrices from tebalance summarize are returned in r(table) and r(size), and its two standardized-difference columns in r(balance).